Get ready for the holidays!
The holiday season is on us and it’s time to start looking at what happened around this time last year!
We know that sales can change around this time of the year. We see different drinks on the menu, seasonal food and a variety of items that are only served this time of year.
With SP-1 we want you to be able to know what happened last year so you can make good decisions as to what to carry this year. Fortunately, we have a number of ways to help you with this.
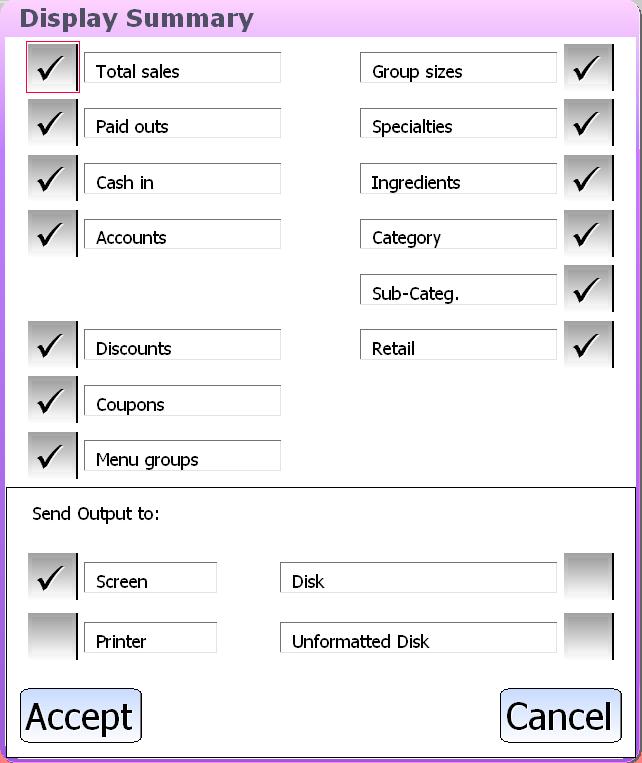
First we can use our Business Summary Report to see what the sales of specific items were last year. Remember that you can run the Business Summary for any time frame – just enter a starting and ending dates.
The Business Summary is made up of a ton of sub-reports.

One of the first things to look at is what promotions you ran over the holidays and how they did. The discount or coupon report is great for this.
With this part of the report you can see each discount, how much was discounted off the price, the total number of times it was used and how popular it was compared to your other discounts.
We can then use this to see what the effective discounts were for that time frame and re-run them.
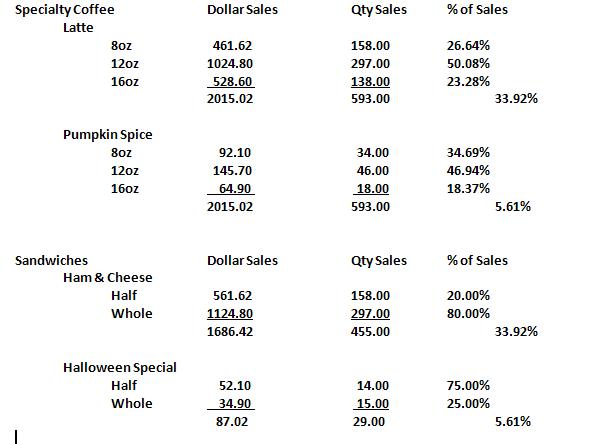
There is one other area we can look at to determine what happened last year. The information below is a sample of our Specialty Report from the Business Summary Recap.

In this example we can see two main menu categories. Specialty Coffee & Sandwiches. In Specialty Coffee, Lattes account for 33.92% of all our drinks and 50.08% of those lattes were 12oz. We can see that the Halloween Special sandwich was 5.61% of our sales during this month. This report is very powerful as it let’s us see which of the items are more popular within their category.
Keep in mind that SP-1 has a number of other reports in the Business Summary that can help you. Give us a call and see what else you might want to look at!
