What’s Selling?
I talk to a lot of people at trade shows and on the phone. One of the things I try to figure out during these conversations is what we can do to help retailers be on top of their sales. Often I hear from store owners that they want a better understanding of what is and is not selling. I usually show them our specialties report on the Business Summary in SP-1.
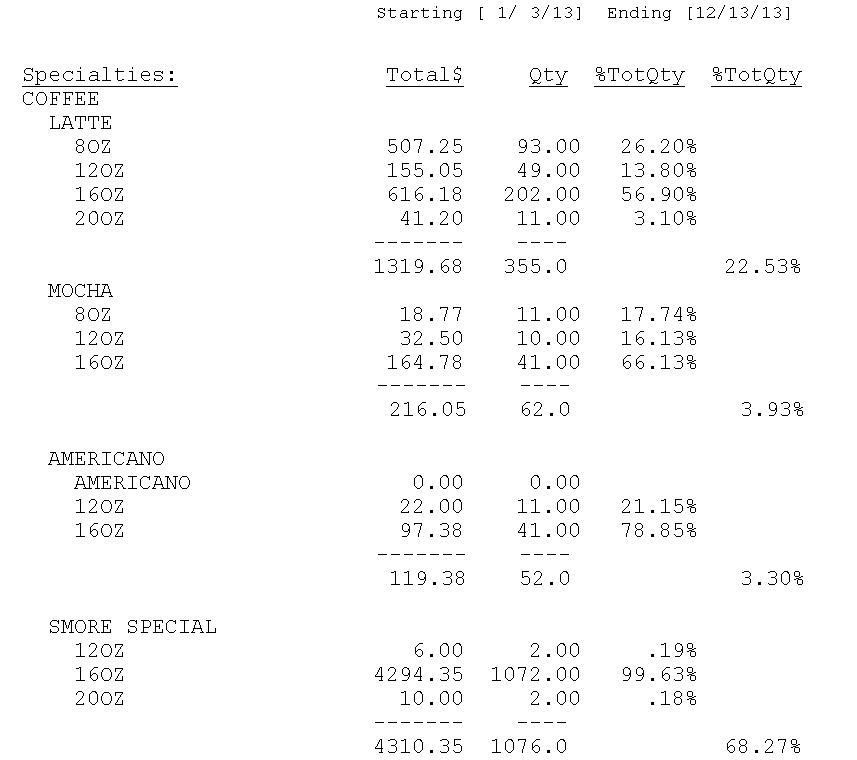
This report shows each specialty or signature item that a store carries. In this example, we are showing both the total dollar and the quantity for each specialty item sold by size. The real powerful figure here is the Percent of Total Quantity that shows. The latte drinks account for 22.53% of total coffee sales and the mocha is 3.93% of those sales.
This report can be run for any time frame (a day, week, month year) that you desire. This is a fantastic way to review new additions to your menu and also to make sure that your current selections are actually making you money!
